Every conversation about China's energy transition eventually hits the same wall. "If China is really leading in solar and wind, why is it still building coal plants?" It's a fair question. In 2025, Chinese developers proposed a record 161 GW of new coal capacity and started construction on more coal than the entire EU coal fleet.
Two of the three real answers are standard energy-analyst material. The third is a petrochemical story that almost no oil-demand model prices, in the West or in China.
Answer One: Replace
China's coal fleet is old. The average Chinese coal plant was built in the early 2000s, during the great infrastructure sprint that transformed the country from a developing economy into the world's largest manufacturer. Many of these plants were built fast, to 1990s-era efficiency standards, and are now reaching the end of their economic life.
The new coal plants being built are not additions to a dirty fleet — they are replacements for a dirtier one. A modern ultra-supercritical coal plant operates at roughly 45–47% thermal efficiency. The fleet average is closer to 38%. Replacing old plants with new ones reduces coal consumption per kilowatt-hour by roughly 20% before any renewables enter the picture.
"China builds record coal" is accurate. "China builds record coal to burn less coal" is also accurate, and more useful.
Answer Two: Backup
In 2024, China installed more solar than the rest of the world combined. Wind installations are running at similar pace. But solar produces power when the sun shines, and wind when it blows, while the grid needs power on its own schedule.
China's answer is coal — not as the primary generation source, but as the backup. New coal plants are being designed and operated as flexible peakers, not baseload generators, and their utilization is falling accordingly.
The signal is not just the utilization curve but the payment mechanism beneath it: since the end of 2023, the NDRC's capacity-payment system has paid coal plants over ¥100 billion a year, not for generation, just for existing. In tariff design, Beijing has already repriced coal from workhorse to insurance.
The coal plants are not competing with solar but enabling it: the cheaper solar gets, the more coal shifts from baseload to backup and the lower its utilization falls. The fleet grows; the fuel consumption doesn't. The NDRC's March 2025 Action Plan made this explicit: new coal approvals are conditional on flexibility retrofitting.
There is nothing inherently wrong with a coal-fired electron. The question was always which source supplies the incremental one — and in 2025 the answer stopped being coal: coal generation fell 71 TWh while demand grew 5%, the entire increment carried by clean sources.
Answer Three: Petrochemical Pivot
Coal is not just a fuel, it's also a feedstock.
China has spent two decades building a coal-to-chemicals industry. Coal-to-olefins (CTO) converts coal through gasification, methanol synthesis and catalytic cracking into ethylene and propylene, the building blocks of plastics, packaging, textiles, and the entire petrochemical value chain.
CTO uses domestic coal at roughly $90–100 per ton; naphtha cracking, which is how most of the world produces olefins, uses imported oil. At $80 Brent, CTO margins run $112–126 per ton. Naphtha crackers are losing $28 per ton. The higher oil goes, the wider the gap.
The IEA projects continued oil demand growth in petrochemicals through 2030. That projection assumes naphtha remains the dominant feedstock. It doesn't have a line item for a Chinese coal-to-chemicals industry that is larger than most countries' entire petrochemical sectors, running on domestic coal, with cost structures that improve every year while oil-based competitors face permanently elevated input costs.
Hydrogen-CTO: The Next Step
Conventional CTO has a weakness: the water-gas shift reaction. Converting coal syngas into useful hydrogen requires burning carbon — roughly 40–50% of the coal's carbon is wasted as CO₂ in this step. It works, but it's inefficient.
The solution is to replace the water-gas shift entirely with green hydrogen from electrolysis. Solar-powered electrolyzers produce both cheap hydrogen and cheap oxygen as a byproduct — removing the two most expensive steps in the CTO process (the air separation unit and the water-gas shift reactor). Carbon utilization efficiency roughly doubles. CO₂ emissions drop 50–55%.
Japan and Germany have invested billions in hydrogen strategies and publicly champion the "hydrogen economy." But hydrogen economics are energy economics — and at $4.90/kg in Japan and $7.00/kg in Germany, their hydrogen is four to six times more expensive than the best-sited Chinese desert production. The gap is not technological. Both countries have world-class electrolyzer engineering. The gap is energy cost: Japanese and German electricity is 4–8× more expensive than off-grid solar in Ningxia or Inner Mongolia. No subsidy closes that spread. The countries most vocal about hydrogen are structurally locked out of competitive hydrogen production.
The hydrogen is the storage: run the electrolyzer when the sun shines, store the output, feed it to the CTO reactor continuously. No grid connection, no curtailment, and batteries sized to keep the electrolyzers running, not to carry the plant. Desert solar at $0.015–0.02/kWh directly attached to an electrolyzer directly attached to a chemical plant.
It Already Exists
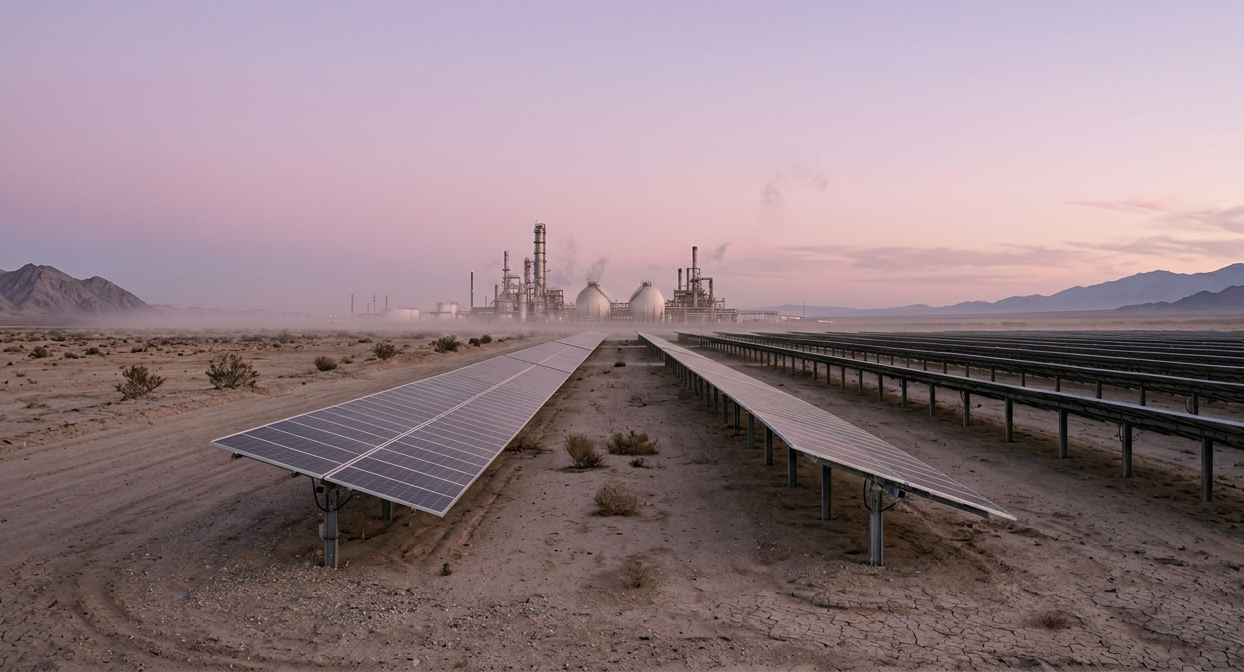
In Ningxia, Baofeng Energy runs the largest single-site electrolytic hydrogen plant in the world: a 200 MW dedicated solar array feeding thirty 1,000 Nm³/h alkaline units, 240 million cubic meters of green hydrogen and 120 million of green oxygen a year, piped straight into the coal-chemical complex. It has run since 2021, and it is a supplement rather than a substitution — enough to take 5% off those plants' carbon emissions, against 2.2 million tonnes of olefins still made mostly from coal.
The scale build is at Ordos in Inner Mongolia: 3 million tonnes of olefins in Phase I inside a 5 million tonne site plan, 400,000 tonnes of it designed to run on green hydrogen. The olefins reached full production in April 2025 and made 2.58 million tonnes last year. The electrolysers that green them are under construction to 2027.
What it means for oil
This isn't going to displace 10 million barrels per day of oil demand. CTO operates at the margin — perhaps stripping 1–2 mb/d of structural demand by 2030. But in commodity markets the margin sets the price, and the difference between a balanced oil market and a price-crushing surplus is roughly that 2 million barrels a day.
It is written plainly into the plans, the capacity data and the commissioning announcements.
Get the next post by email. No spam.